
Looking at 100 years of gender inequality in art.
Using Artfact’s unparalleled art database, we have the results of a particularly interesting data query to share with you today.
By now, we’re all glaringly aware of the gender gap between exhibited artists worldwide. We all know it has improved, but – and here’s where it gets interesting– by how much??
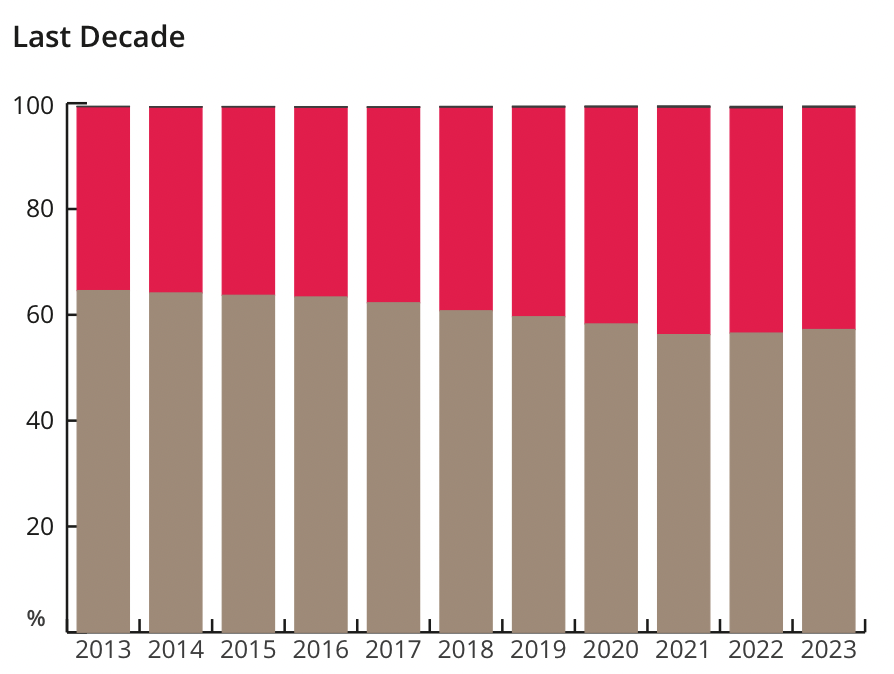
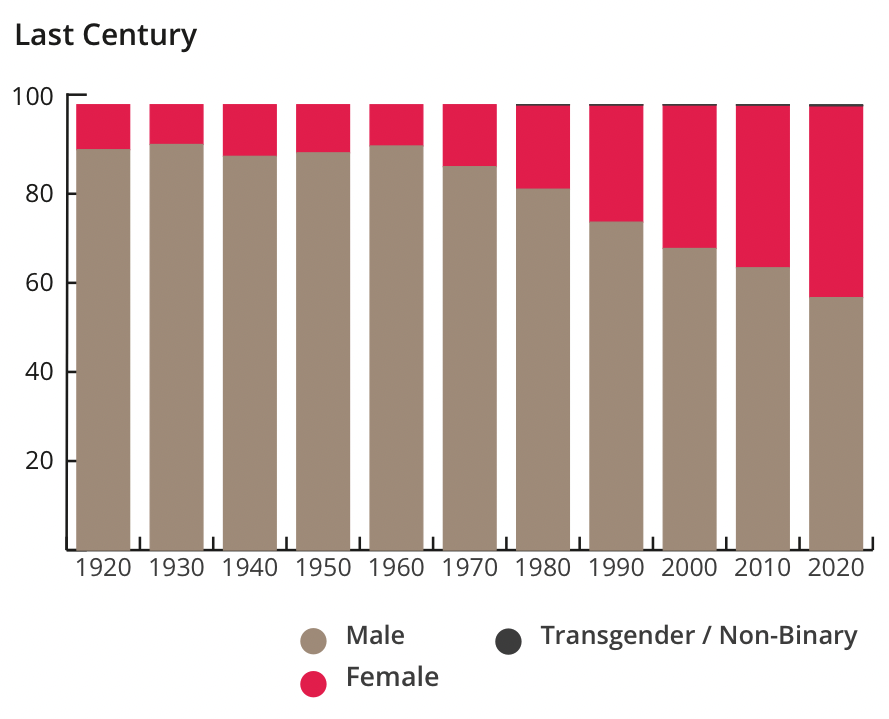
According to our data, in 1923 female artists were included in just 10.15% of art exhibitions; that number has risen gradually over the past century, to reach 42.16 % in 2023. Progress? Surely, but it should be noted that these numbers do not represent museum collections, nor the inclusion in permanent exhibitions, which are still left severely wanting.
Almost 40 years after the Guerilla Girls drew international attention with their posters demanding a change to the inequalities surrounding the inclusion of female artists in museum collections, we’re certainly a lot closer, but we’re not there yet.
Despite the existence of transgender and non-binary artists over the last century, the data-collection on those artist’s participation in exhibitions is a little harder to track, as until relatively recently many of the artists would not have had the safety to openly present their identity. According to our data, just a decade ago, trans and non-binary artists were each included in just 0.025% of exhibitions – that inclusion has risen to just 0.074% for transgender artists and 0.19% for non-binary artists in 2023. Perhaps earlier than many of you would have guessed, in the Artfacts database the first transgender artist to be exhibited was Anton Prinner in his solo show, Sculptures et Dessins de Prinner in 1942.
A little note before exploring our graphs: some artists are yet to have a gender assigned to their profile in our database, and therefore this query reflects the data we have on artists with their gender included on their profile (which is still the majority).
Our first graph offers a zoomed-in look at the last 10 years to see just how quickly things are changing. Our second graph offers a look at the bigger picture, making it easier to track the effects of historical movements on the inclusion of female, trans, and non-binary artists in exhibitions. Due to the incredibly low ratio of trans and non-binary artists included in exhibitions, we have combined their results to increase visibility in the graphs.
We hope you’ve found this special data query as interesting as we have; there’s nothing like seeing the facts in black and white. The last few decades have seen a significant shift in inclusion, let us hope that this shift towards equal representation continues in the right direction.
Expand the way you see art,